A Probabilistic Framework for the Automated Analysis of the Exposure to Road Collision
TRB 87th Annual Meeting (2008), paper reference 08-2916
Nicolas Saunier and Tarek Sayed
Abstract: The advent of powerful sensing technologies, especially video sensors and computer vision techniques, has allowed for the collection of large quantities of detailed traffic data. They allow us to further advance towards completely automated systems for road safety analysis. This paper presents a comprehensive probabilistic framework for automated road safety analysis. Building upon traffic conflict techniques and the concept of the safety hierarchy, it provides computational definitions of the probability of collision for road users involved in an interaction. It proposes new definitions for individual road users and aggregated measures over time. This allows the interpretation of traffic from a safety perspective, studying all interactions and their relationship to safety. New and more relevant exposure measures can be derived from this work, and traffic conflicts can be detected. A complete vision-based system is implemented to demonstrate the approach, providing experimental results on real world video data.
[bib] [pdf] [poster pdf]
This page offers additional material for the experimental results. The figures regarding the traffic conflict in sequence 1 are reposted, and videos are available at the bottom of the page.
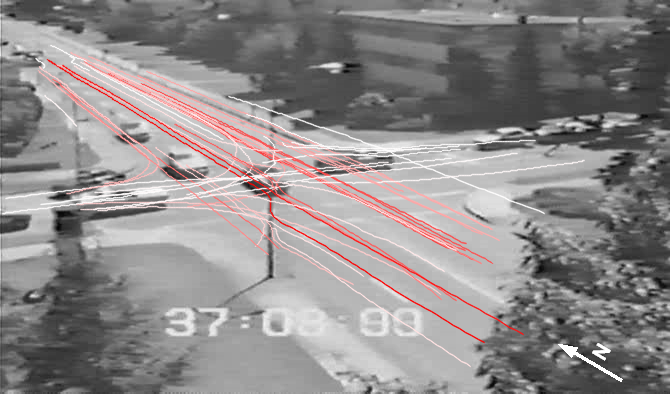
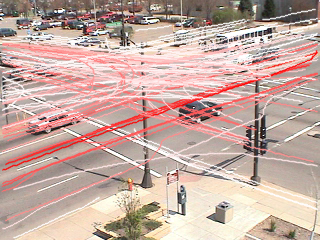
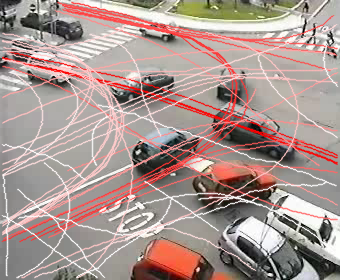
FIGURE 3: Motion patterns learnt respectively on sequences of the Conflict dataset (top), the Minnesota dataset (bottom left) and the Italy dataset (bottom right), resulting respectively in 58, 128 and 58 prototype trajectories. The tracks are displayed in color, from white to red indicating the number of matched trajectories in the sequence for each pattern, i.e. the traffic volume along these patterns.
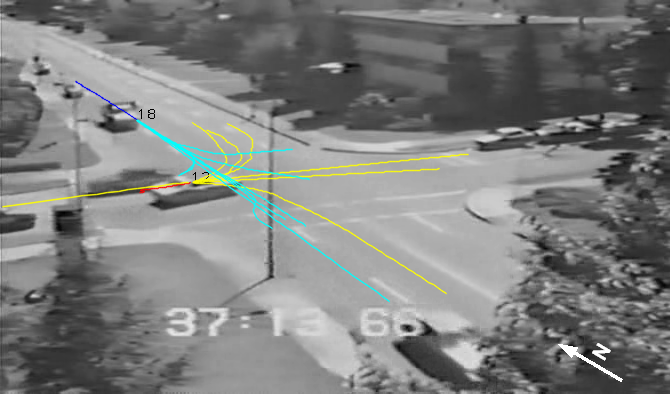
FIGURE 4: An example of movement prediction in a real traffic conflict situation (Sequence 1, See Figure 5). The vehicle trajectories are red and blue, with a dot marking their position, and the future positions are respectively cyan and yellow.
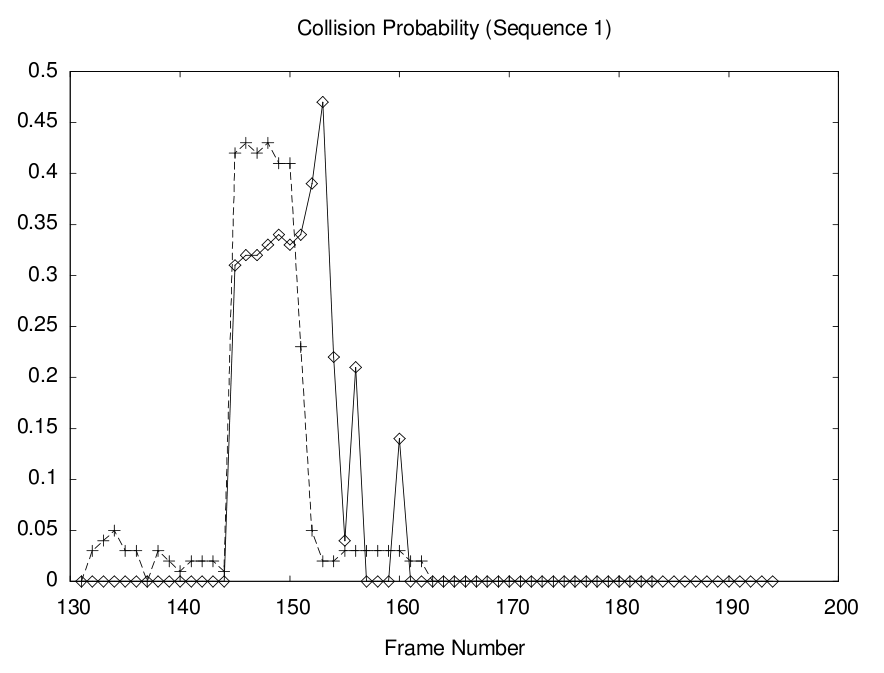
FIGURE 5: The collision probability for the traffic conflict in sequence 1, as a function of time (counted in frame numbers). Vehicle 1 travels south-bound through the intersection and vehicle 2 comes from an opposing approach and turns left in sequence 1.
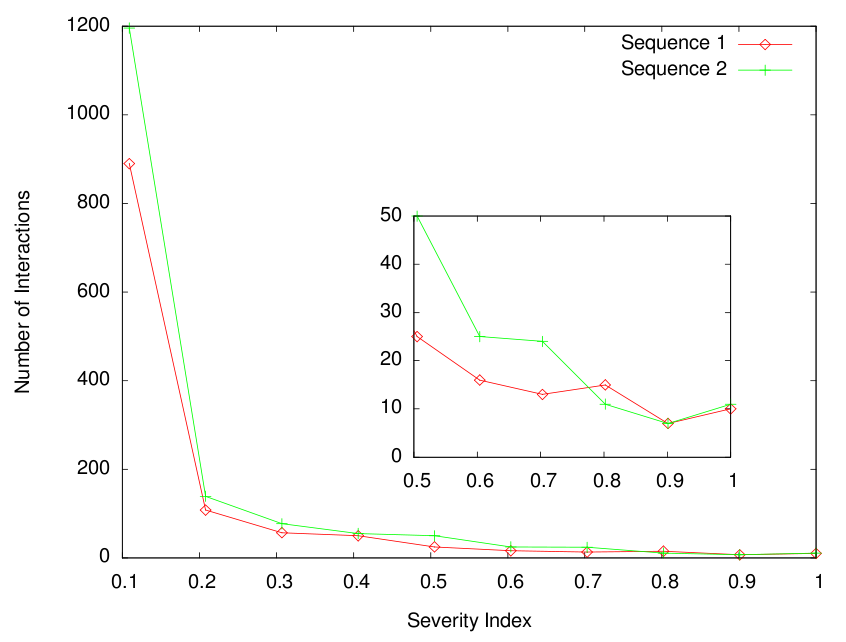
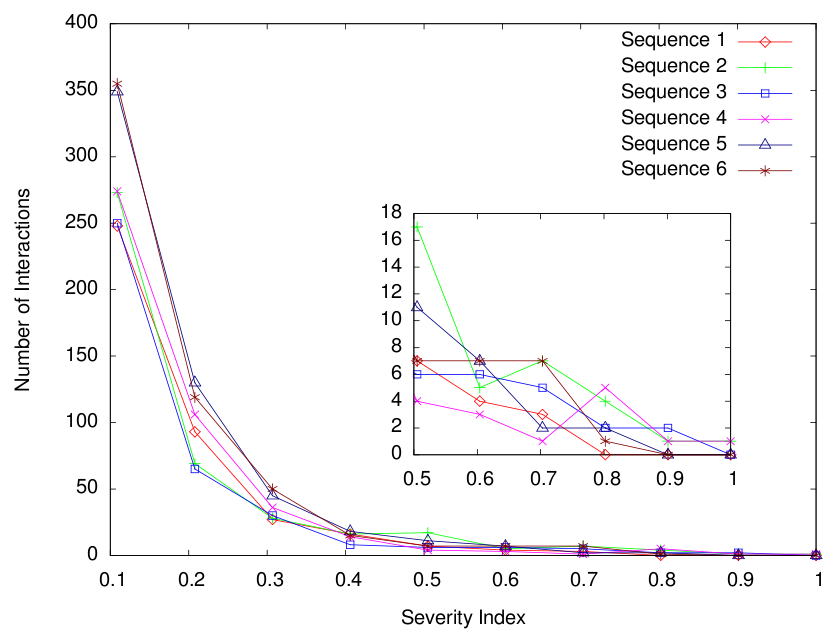
FIGURE 6: Distribution of the interactions according to their severity indices (with a zoom on the higher severities), quantified by 0.1 (the point at severity index x stands for the number of interactions with severity index between x-0.1 and x), for the Minnesota dataset (top) and the Italy dataset (bottom).
Videos are added to the paper (install the cross-platform open source player VLC if the video does not play on your computer):
- The evolution of the learnt prototype trajectories on the "Minnesota" dataset, resulting in 128 prototype trajectories. [avi]
- A video of the conflict of sequence 1, with the future positions for both vehicles as computed by the system (same color code as for Figure 6). [avi]